Simple global climate models, like Hector, provide an efficient alternative to complex climate models as they can run essentially instantaneously and still represent the most critical global scale Earth system processes. Hector runs extremely quickly, includes a tutorial with the software, and is well-documented in the literature; however, using it effectively requires a learning curve and level of skill/knowledge base that can deter potential users. The Hector user interface (hectorui) enables new users to access the core functionality of Hector in an easy-to-navigate web application. A custom tutorial walks users through setting up an experiment, allowing them to execute Hector in real time under a variety of conditions without any additional software.
Providing hectorui on an open access website makes the model accessible to anyone, regardless of whether they meet the technical requirements necessary to download, install, and run the model locally. Users can alter Hector’s parameters and run the model in real time, producing informative graphics. They can also download the results to use in other scientific studies. The ease and approachability of this type of interactive interface will hopefully promote its use in the classroom during introductions of key concepts of climate modeling. Its availability can broaden the reach of the MultiSector Dynamics community to future generations of researchers.
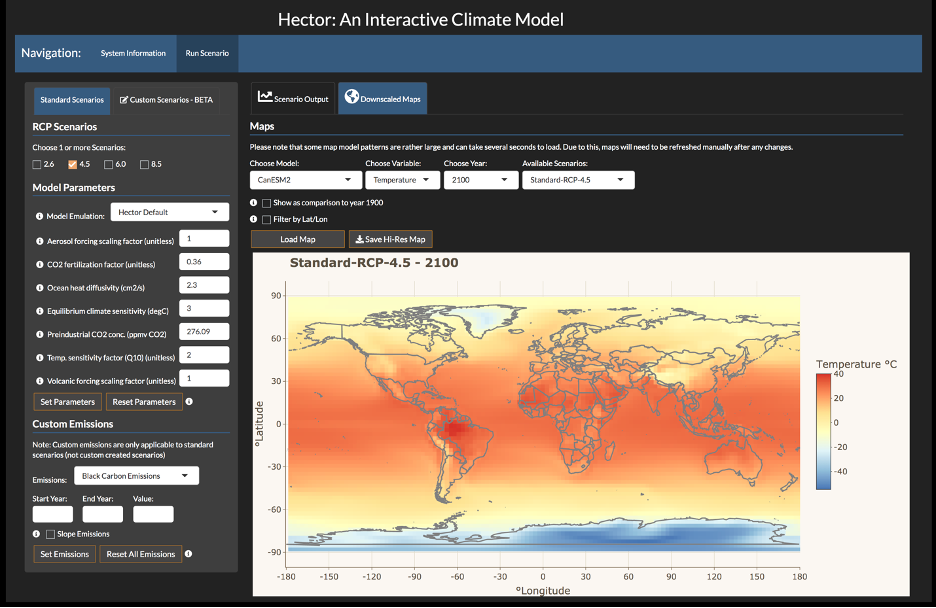
Interdisciplinary science is rapidly evolving, increasing the importance of reaching a broad user base. This requires continued effort to ensure that open source models remain technically sound and relevant, while finding opportunities to create introductory tools that bring in new users. The hectorui provides a web-based, point and click dashboard type interface that communicates with the Hector model, retains full functionality, and offers novel capabilities for interpreting the model output. This interface serves several important functions to increase overall model effectiveness, including enabling rapid scenario prototyping, the presence of available pre-built customizable graphs and maps, and enhancing user accessibility, all from the familiarity of a browser. The hectorui app also includes additional features like real-time downscaling of annual global temperature and precipitation data to a 0.5-degree grid that enables users to investigate the resulting spatial patterns.
Reference
J. Evanoff, C.R. Vernon, S. Waldhoff, A. Snyder, C. Hartin. “hectorui: A web-based interactive scenario builder and visualization application for the Hector climate model.” Journal of Open Source Software 5(56), 2782, (2020). https://doi.org/10.21105/joss.02782